Dollar Cost Averaging Calculator: Should You Invest a Lump Sum or Dollar Cost Average?
The Lump Sum vs Dollar Cost Averaging Decision
When you have a large sum to invest—whether from a bonus, inheritance, sale of property, or accumulated savings—one of the most important decisions is whether to invest it all at once (lump sum) or spread investments over time (dollar cost averaging). Our dollar cost averaging calculator helps you compare both strategies across various market scenarios to make an informed decision.
What This Calculator Does
The dollar cost averaging (DCA) calculator simulates both investment strategies using realistic market conditions:
Dollar Cost Averaging Analysis - The calculator shows results when you divide your total investment amount into equal monthly investments over your chosen time period (commonly 6-24 months). Each month, you invest the same dollar amount, buying more shares when prices are low and fewer when prices are high. The calculator tracks your average cost per share and final portfolio value.
Lump Sum Analysis - The calculator shows results when you invest your entire amount immediately on day one, with returns depending entirely on market performance from that point forward. This strategy has higher upside potential but also higher timing risk.
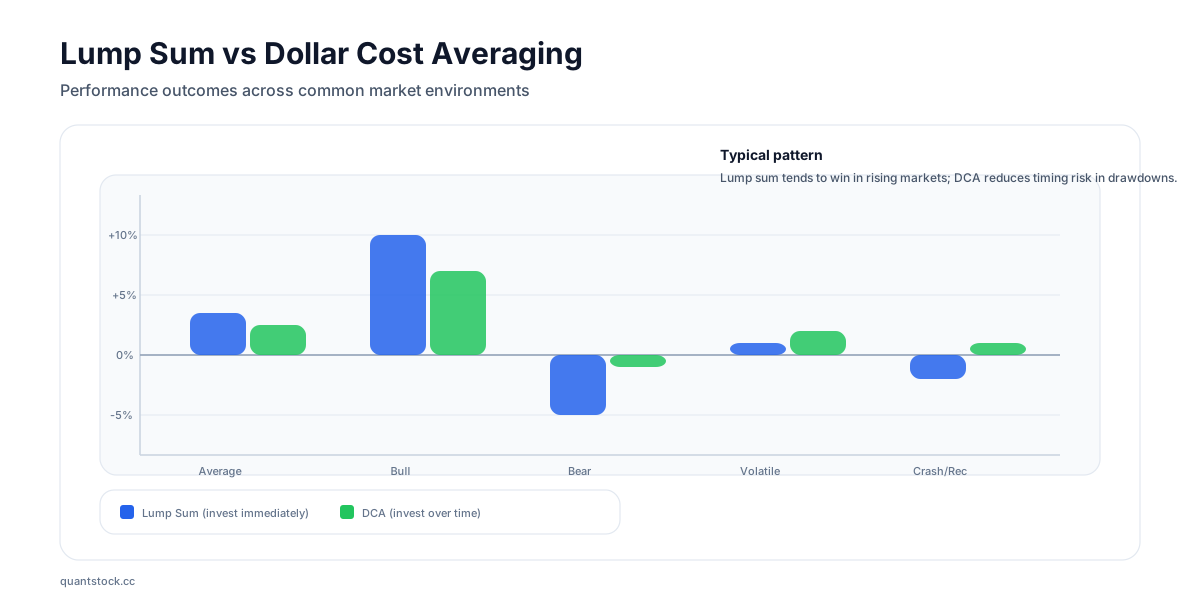
Market Scenario Modeling - The calculator simulates various market conditions:
- Historical average markets (steady upward trend)
- Bull markets (strong upward trend)
- Bear markets (declining values)
- Volatile markets (high fluctuation)
- Crash-and-recovery scenarios
This helps you see how each strategy performs across different environments rather than assuming one market outcome.
Performance Comparison - The calculator quantifies the difference between strategies, showing which approach would have left you better off and by how much. It also calculates risk reduction from DCA and behavioral advantages.
Who Should Use This Calculator
This calculator is valuable for:
Investors with lump sum amounts from bonuses, tax refunds, inheritance, property sales, or accumulated cash savings who need to decide the optimal entry strategy.
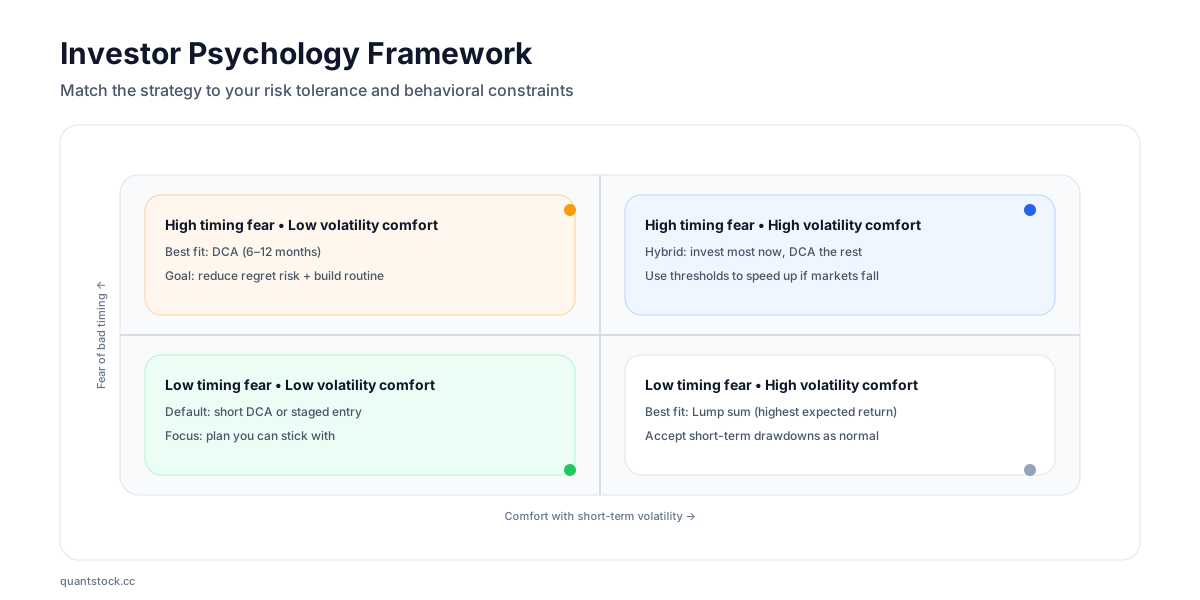
First-time investors who feel anxious about putting all their money into the market at once. DCA can provide psychological comfort during the initial investment period.
Market-timers concerned about buying at peaks. If you worry about investing before a market crash, this calculator helps quantify the actual risk and shows how DCA reduces timing risk.
Those experiencing analysis paralysis who have cash sitting idle because they can't decide when to invest. The calculator helps break the decision paralysis.
How the Calculator Works
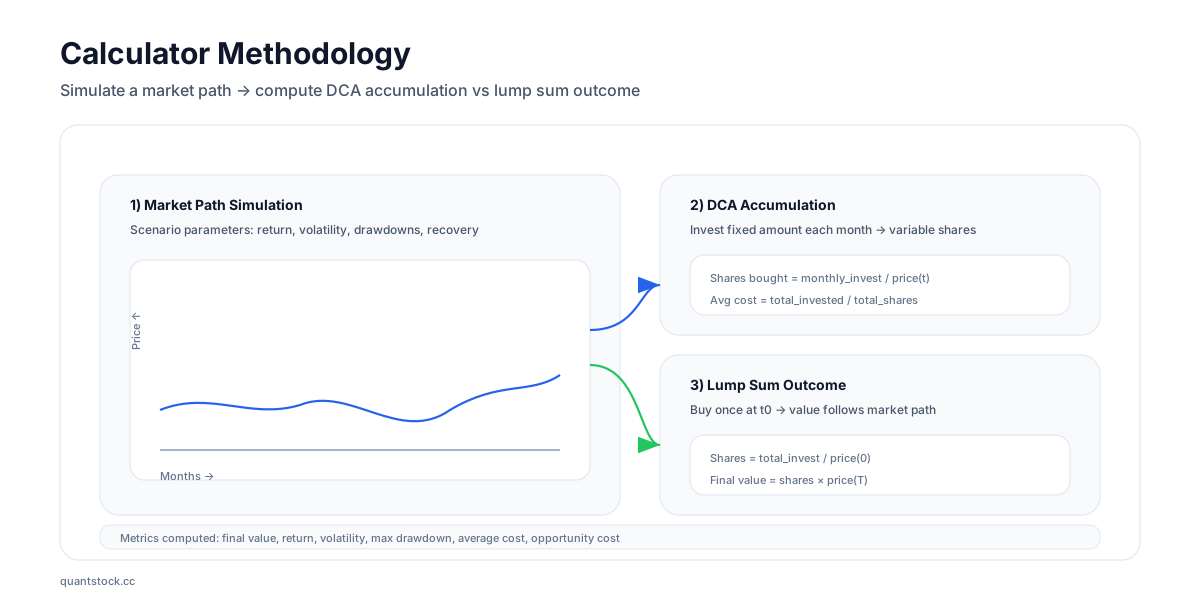
The dollar cost averaging calculator uses sophisticated market simulation:
Market Price Generation
The calculator generates realistic monthly price movements based on:
- Historical stock market volatility (standard deviation around 15% annually)
- Expected return rates based on long-term market averages
- Mean reversion (markets tend toward long-term averages)
- Fat-tail events (occasional large moves, both up and down)
- Market scenario adjustments (bull/bear/volatile characteristics)
DCA Strategy Implementation
For dollar cost averaging:
- Total investment amount divided by number of months
- Each month, the same dollar amount is invested
- Shares purchased = monthly investment amount / current share price
- Total shares accumulate month by month
- Average cost per share = total invested / total shares owned
- Final value = total shares × final share price
Lump Sum Strategy Implementation
For lump sum investing:
- Entire amount invested at initial share price
- Shares purchased = total investment / initial share price
- Portfolio value fluctuates with market
- Final value = shares owned × final share price
Risk Metrics Calculation
The calculator quantifies:
- Volatility of returns under each strategy
- Maximum drawdown (worst peak-to-trough decline)
- Average cost per share for DCA vs. lump sum entry price
- Psychological risk reduction from DCA
- Opportunity cost of remaining partially uninvested during DCA period
How to Use the Calculator (Step-by-Step)
Step 1: Enter Your Total Investment Amount
Input the total amount you have available to invest. This could be $10,000, $50,000, $100,000, or any amount. The calculator shows results proportionally, so it works for any investment size.
Step 2: Select Your Investment Period
Choose how many months you'd spread DCA investments over. Common options:
- 6 months (faster deployment, less market risk)
- 12 months (balanced approach, recommended by many advisors)
- 18-24 months (maximum averaging, highest opportunity cost)
Shorter periods have less opportunity cost but provide less averaging benefit. Longer periods provide more averaging but cost more in potential gains.
Step 3: Choose Market Scenario
Select from:
- Historical Average: Typical market conditions with normal volatility and upward bias
- Bull Market: Strong upward momentum (favors lump sum heavily)
- Bear Market: Declining values (favors DCA significantly)
- Volatile/Sideways: High fluctuation without clear direction (DCA shows its benefit)
- Crash-Recovery: Initial sharp decline followed by recovery (shows timing risk)
Try multiple scenarios to see how results vary.
Step 4: Set Expected Annual Return
Input your expected stock market return. Historical averages are around 10% before inflation. Conservative estimates use 7-8%, moderate estimates use 8-9%. This affects the magnitude of differences between strategies but usually not which strategy wins.
Step 5: Review Results
The calculator shows:
- Final portfolio value for both strategies
- Total return for each
- Which strategy performed better and by what percentage
- Average cost per share for DCA
- Risk metrics and volatility measures
- Market condition specifics (volatility, drawdowns, trends)
Step 6: Consider Multiple Runs
Because the calculator simulates market randomness, run it several times with the same settings to see result variability. This helps you understand the range of possible outcomes rather than relying on a single simulation.
How to Interpret the Results
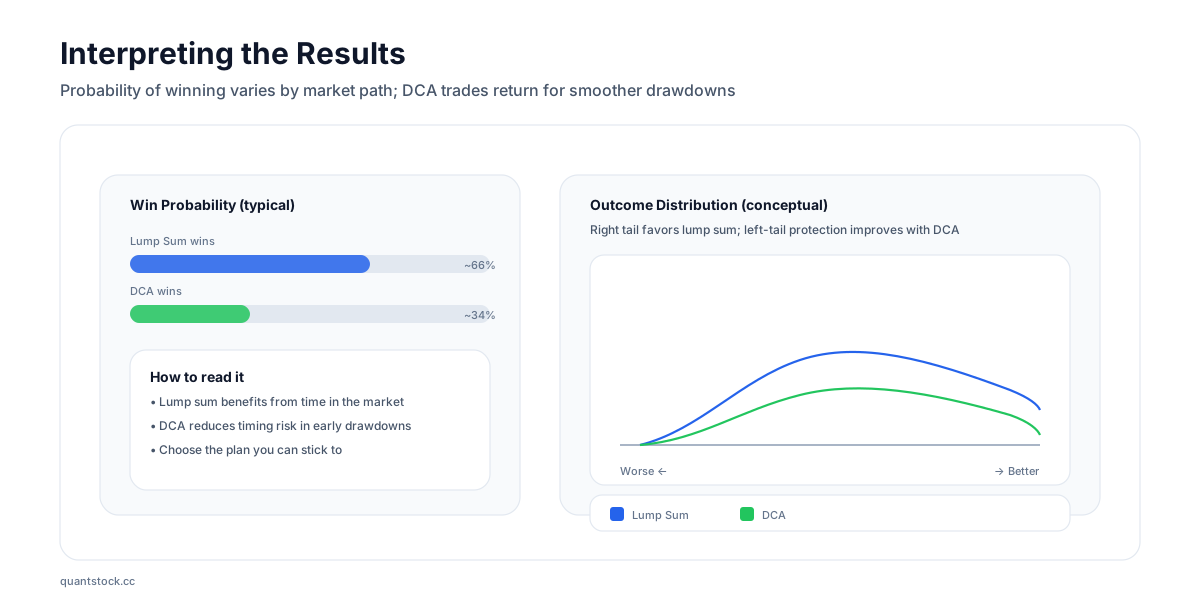
When Lump Sum Wins: Lump sum typically wins in 60-70% of historical scenarios, particularly in:
- Rising markets (your money is fully invested earning returns immediately)
- Low volatility environments (timing risk is minimal)
- Longer time horizons (more time for compound growth)
The win margin is often 2-5% of total portfolio value, sometimes more in strong bull markets. Lump sum maximizes upside potential but carries maximum timing risk.
When DCA Wins: DCA wins in 30-40% of scenarios, particularly in:
- Declining markets (you buy more shares at lower prices)
- High volatility periods (averaging reduces impact of price swings)
- Market corrections shortly after starting (lump sum would have bought at peaks)
DCA's advantage is often 3-8% in favorable scenarios like bear markets. DCA reduces timing risk but guarantees opportunity cost by remaining partially uninvested.
Risk Reduction Benefit: Even when DCA underperforms, it typically reduces volatility and maximum drawdown by 20-40%. This smoother experience might be worth 1-2% lower returns for risk-averse investors.
The Average Difference: Across all market conditions, lump sum averaging wins by approximately 1-3% over DCA periods of 12 months. This is the expected "cost" of DCA. However, this average hides significant variation—sometimes lump sum wins big, sometimes DCA wins big.
Real-World Use Cases
Case 1: Inheritance Decision
Maria receives $100,000 inheritance. Market is at all-time highs, making her nervous about lump sum investing. Calculator shows that even in crash-recovery scenario, lump sum loses only 5% compared to 12-month DCA, while in historical average scenario, lump sum wins by 3%. Maria invests lump sum since even worst-case scenario difference is modest.
Case 2: Nervous First-Time Investor
James has saved $30,000 but has never invested before. Market feels "too high." Calculator shows DCA over 6 months reduces his maximum drawdown by 30% while costing only 1% in expected returns. James chooses DCA because the emotional comfort is worth the small expected cost.
Case 3: Market Timer Who Never Invests
Susan has had $50,000 in savings for 2 years, waiting for "the crash" to invest. Calculator demonstrates that even poor timing with lump sum would have significantly outperformed holding cash waiting for perfection. Susan invests lump sum, realizing that waiting for perfect timing is more costly than potential bad timing.
Case 4: Bonus Investment
David receives $25,000 year-end bonus. He runs calculator showing that in 75% of simulations, lump sum wins over 12-month DCA. However, he also notes DCA performed better in declining/volatile scenarios. Since David can't predict market conditions, he chooses lump sum based on probability but emotionally prepares for possible short-term decline.
Common Mistakes to Avoid
Waiting to Start DCA
Some people decide to use DCA but wait for a "good entry point" to begin. This defeats the purpose. If you've decided on DCA, start immediately—waiting to start DCA is just another form of market timing.
Extending DCA Too Long
Spreading investments over 24-36 months creates enormous opportunity cost. The longer your DCA period, the more certain it becomes that lump sum would have been better. Keep DCA periods to 12 months or less unless you have specific reasons for longer periods.
Using DCA for Small Amounts
DCA is meant for lump sums large enough to represent significant portfolio allocation. For regular monthly investing (like automatic 401k contributions), you're already dollar cost averaging naturally—no separate strategy needed.
Stopping DCA in Down Markets
Some investors start DCA but stop contributing when markets decline, defeating the entire purpose. DCA works by buying more shares when prices are low. If you'll stop during declines, just invest lump sum initially.
Confusing DCA with "Buying the Dip"
DCA is systematic, emotionless investing at regular intervals regardless of market conditions. "Buying the dip" is market timing—holding cash and waiting for declines. These are opposite strategies. DCA removes timing decisions; "buying the dip" is entirely about timing decisions.

Related Calculators
Investment strategy decisions connect to broader portfolio management:
Compound Interest Calculator - After deciding your investment timing strategy, see how those investments will grow over decades with compound returns. Understand the long-term wealth creation regardless of entry strategy.
Portfolio Rebalancing Calculator - Once you've made your lump sum or DCA investments, you'll need to rebalance your portfolio over time. Calculate optimal rebalancing frequency and thresholds.
Portfolio Optimizer - After deploying your capital, optimize your asset allocation for maximum risk-adjusted returns using Modern Portfolio Theory.
Frequently Asked Questions
Q: What does the research say—lump sum or DCA?
Vanguard's 2012 study found lump sum outperforms DCA approximately 66% of the time across US, UK, and Australian markets over rolling 10-year periods. However, DCA's underperformance is typically modest (2-3%), while risk reduction is significant. The decision depends on your risk tolerance more than expected returns.
Q: Doesn't Warren Buffett recommend DCA?
Buffett recommends regular investing over time for most people (automatically investing from each paycheck), which is different from choosing DCA for lump sums. When Buffett receives large capital, he invests immediately. For regular people with regular income, automatic investing is simply how you build wealth—it's not DCA by choice.
Q: Should I DCA into individual stocks?
No. DCA is meant for diversified investments (index funds, ETFs, mutual funds). For individual stocks, either the company is undervalued (buy immediately) or it's not (don't buy at all). Spreading purchases of individual stocks over time just increases your transaction costs without diversification benefits.
Q: What if markets crash right after I invest lump sum?
This is the primary risk of lump sum investing. However, remember: 1) You can't predict crashes with reliability, 2) Historically, most crashes recover within 2-3 years, 3) Long-term wealth building overcomes short-term volatility, 4) If risk of crash causes you significant stress, use DCA for peace of mind.
Q: Can I DCA into retirement accounts?
You can set up automatic monthly investments into IRAs or taxable accounts. For employer 401(k)s, you're already dollar cost averaging via paycheck contributions. If you have lump sum funds in a 401(k) (from rollover), you can set up automatic monthly transfers from a stable value fund to your target allocation.
Q: How do taxes affect DCA vs lump sum?
In taxable accounts, DCA creates multiple tax lots with different cost bases, which gives flexibility for tax-loss harvesting. Lump sum creates a single cost basis. This is a minor advantage to DCA. In tax-advantaged accounts (IRA, 401k), taxes don't affect the decision—focus purely on investment performance.
Q: What if I choose DCA but markets rise strongly?
You'll underperform lump sum and kick yourself. Remember: DCA is insurance against bad timing, not a free benefit. Insurance has costs. DCA's cost is opportunity cost when markets rise. You're paying a premium (potential underperformance) for protection (reduced timing risk).
Q: Should I use DCA when I'm rebalancing a large portfolio?
No. Rebalancing is moving from one investment to another within an existing portfolio. Do it immediately in a single transaction. DCA is only relevant for new cash entering the market from outside sources.
Start Investing with Confidence
The DCA vs lump sum decision is important, but not as important as actually investing your money consistently for the long term. Both strategies build wealth over decades. The difference in outcomes is typically modest compared to the difference between investing and not investing.
Historical evidence favors lump sum investing, but psychological evidence favors whatever strategy you'll actually execute without abandoning during market volatility. Use the calculator to understand the mathematical trade-offs, then choose the strategy that lets you sleep at night while keeping your money fully invested.
The best investment strategy is the one you'll stick with through market ups and downs. Calculate your personalized comparison with our dollar cost averaging calculator today, and explore our portfolio optimization tools to maximize your returns once invested.
Free Trading Math & Risk Cheat Sheet
Every key formula in one PDF: breakeven win rates, expectancy, position sizing, drawdown recovery, volatility drag, VaR and CVaR. Plus occasional emails when we publish new quant tools.