Machine Learning for Asset Price Prediction: Models, Techniques and Limitations
The Evolution of Prediction Methods in Finance
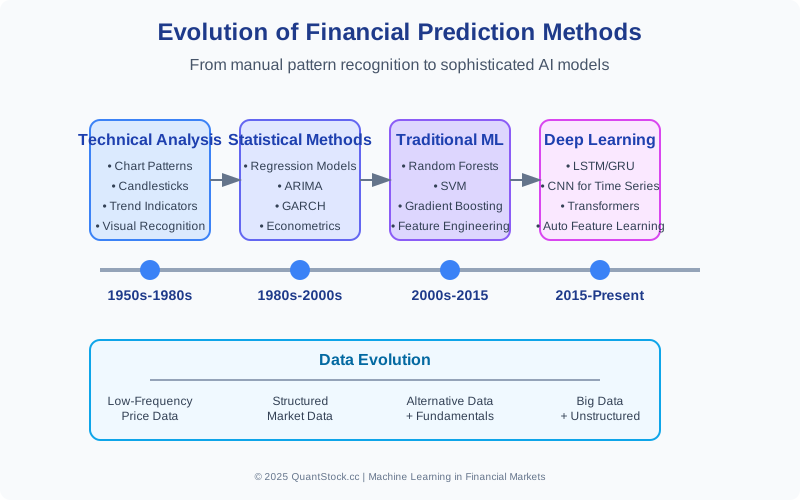
Financial markets have witnessed a remarkable evolution in predictive methodologies—from the intuitive chart patterns of early technical analysts to today's sophisticated machine learning algorithms capable of processing vast, multidimensional datasets.
From Technical Analysis to Statistical Learning
Traditional technical analysis, with its candlestick patterns and trend indicators, represented the first systematic attempt to predict price movements based on historical data. These approaches relied heavily on visual pattern recognition and heuristic rules developed through practitioners' experience.
As computational capabilities advanced, classical statistical methods emerged—moving from simple regression models to more sophisticated time series techniques like ARIMA (Autoregressive Integrated Moving Average) and GARCH (Generalized Autoregressive Conditional Heteroskedasticity) that could capture the unique characteristics of financial data, including volatility clustering and mean reversion.
The Data Revolution in Financial Markets
The exponential growth in available data has fundamentally transformed financial prediction:
- Market Data: Higher frequency price data, order book information, and cross-asset relationships
- Fundamental Data: More granular and timely economic indicators, earnings metrics, and company-specific information
- Alternative Data: Satellite imagery, social media sentiment, credit card transactions, and other non-traditional information sources
- Unstructured Data: News articles, earnings call transcripts, and regulatory filings processed through natural language techniques
This data explosion has created both opportunity and necessity for more sophisticated analytical approaches capable of extracting meaningful signals from noise.
The Machine Learning Advantage
Machine learning offers several key advantages over traditional statistical methods for financial prediction:
- Non-linearity: Capturing complex, non-linear relationships between variables
- Feature Interactions: Automatically detecting and modeling interactions between predictors
- Adaptability: Learning from new data patterns without requiring explicit reprogramming
- Dimensionality: Handling high-dimensional datasets with hundreds or thousands of potential predictors
These capabilities have enabled machine learning approaches to detect subtle patterns in market behavior that would be invisible to traditional analysis.
Foundational ML Models for Asset Pricing
Before diving into advanced deep learning techniques, it's important to understand the fundamental machine learning models that form the foundation of many successful prediction systems.
Linear Models and Their Extensions
Despite their simplicity, linear models remain surprisingly effective for many financial applications when properly implemented:
- Lasso and Ridge Regression: Add regularization to improve stability and prevent overfitting
- Elastic Net: Combines L1 and L2 regularization to handle correlated predictors while maintaining feature selection
- Quantile Regression: Models different portions of the return distribution rather than just the mean
These approaches shine in their interpretability and robustness, often outperforming more complex models when data is limited or noisy.
Tree-Based Methods (Random Forests, Gradient Boosting)
Tree-based ensemble methods have demonstrated remarkable effectiveness in financial prediction tasks:
- Random Forests: Combine multiple decision trees trained on different data subsets and features, reducing variance while maintaining the ability to capture non-linear relationships
- Gradient Boosting (XGBoost, LightGBM, CatBoost): Sequentially build trees that correct the errors of previous ones, creating powerful predictive models that often win financial forecasting competitions
These models naturally handle non-linearities, automatically detect feature interactions, and provide measures of feature importance that offer insights into market drivers.
Support Vector Machines in Market Prediction
Support Vector Machines (SVMs) are particularly well-suited for financial classification problems:
- Direction Prediction: Classifying future price movements as up or down
- Regime Detection: Identifying distinct market states or regimes
- Anomaly Detection: Flagging unusual market behavior that may indicate opportunities or risks
SVMs excel through their ability to find optimal decision boundaries in high-dimensional spaces using the "kernel trick," which implicitly maps data into higher dimensions where separation becomes easier.
Deep Learning Approaches for Financial Time Series
Deep learning models have recently gained prominence in financial forecasting due to their ability to automatically extract features and capture complex temporal dependencies.
Recurrent Neural Networks (RNNs, LSTMs, GRUs)
Recurrent architectures are specifically designed to handle sequential data like financial time series:
- Simple RNNs: Maintain a hidden state that captures information from previous time steps
- Long Short-Term Memory (LSTM) Networks: Address the vanishing gradient problem to capture both long and short-term dependencies in price movements
- Gated Recurrent Units (GRUs): A simplified alternative to LSTMs that often achieves similar performance with less computational overhead
These models can process variable-length sequences and learn temporal patterns across different timescales, making them well-suited for capturing market dynamics that operate over different horizons.
Convolutional Neural Networks for Price Patterns
Originally developed for image processing, CNNs have found surprising application in financial time series:
- 1D Convolutions: Detect local patterns in price and volume sequences
- 2D Convolutions: Process multiple time series simultaneously, capturing inter-asset relationships
- Pattern Recognition: Automatically identify complex patterns similar to traditional technical analysis formations
CNNs excel at extracting hierarchical features, from simple price movements to complex market patterns, without requiring manual feature engineering.
Transformer Models and Attention Mechanisms
The most recent innovation in sequence modeling, transformers have begun making inroads in financial prediction:
- Self-Attention: Allows the model to focus on relevant parts of the input sequence, regardless of their distance
- Temporal Fusion Transformers: Combine attention mechanisms with recurrent components for time series forecasting
- Cross-Asset Attention: Models relationships between different assets or markets
These architectures are particularly effective at capturing long-range dependencies and complex relationships between different variables or assets.

Feature Engineering for Financial ML
While deep learning can automatically extract features, thoughtful feature engineering remains critical for successful financial machine learning, particularly with traditional algorithms.
Technical Indicators as Features
Technical indicators distill price and volume information into meaningful signals:
- Trend Indicators: Moving averages, MACD, and directional movement indicators
- Momentum Oscillators: RSI, stochastic oscillator, and rate of change
- Volatility Measures: Bollinger Bands, ATR, and standard deviation of returns
- Volume Profiles: On-balance volume, accumulation/distribution, and volume-weighted metrics
These engineered features encode domain knowledge about market behavior that may help models converge faster and generalize better than raw price data alone.
Fundamental Data Integration
Fundamental data provides crucial context beyond price patterns:
- Financial Ratios: P/E, P/B, debt-to-equity, and other valuation metrics
- Growth Metrics: Revenue growth, earnings growth, and other expansion indicators
- Quality Factors: Return on equity, gross margins, and earnings stability
- Macro Variables: Interest rates, inflation, GDP growth, and other economic indicators
The challenge lies in aligning this data temporally, as fundamental information is released at irregular intervals and with varying degrees of lag.
Alternative Data Sources and Their Value
Alternative data can provide unique predictive signals before they appear in market prices:
- Sentiment Analysis: Social media, news, and other text sources processed through natural language processing
- Satellite Imagery: Retail parking lots, oil storage facilities, agricultural production, and shipping activity
- Transaction Data: Credit card spending, app downloads, and other consumer behavior metrics
- Web Traffic: Website visits, search trends, and digital engagement metrics
These data sources often require specialized preprocessing and feature extraction techniques to convert raw information into predictive signals.
Model Evaluation Beyond Accuracy
In financial applications, standard machine learning evaluation metrics can be misleading. More sophisticated approaches are needed to ensure models deliver real-world value.
Financial-Specific Performance Metrics
Financial models should be evaluated on metrics that align with investment objectives:
- Risk-Adjusted Returns: Sharpe ratio, Sortino ratio, and information ratio
- Maximum Drawdown: Worst peak-to-trough decline during the evaluation period
- Hit Rate: Percentage of directional predictions that are correct
- Profit & Loss: Simulated trading results accounting for transaction costs and slippage
These metrics provide a more realistic assessment of model performance than standard classification or regression metrics.
Walk-Forward Testing and Time Series Validation
Time series data requires specialized validation approaches to prevent look-ahead bias:
- Walk-Forward Validation: Incrementally expanding the training window and evaluating on subsequent periods
- Time Series Cross-Validation: Multiple train-test splits that respect the temporal ordering of data
- Out-of-Sample Testing: Reserving a completely separate time period for final evaluation
These approaches provide a more realistic assessment of how models will perform on truly unseen future data.
Accounting for Transaction Costs and Slippage
A model that looks profitable on paper may fail in practice due to implementation costs:
- Transaction Costs: Commissions, fees, and bid-ask spreads
- Market Impact: Price slippage when executing trades, especially for larger positions
- Execution Timing: Delays between signal generation and trade execution
Realistic backtesting should incorporate these factors to avoid strategies that generate frequent small-margin trades that wouldn't be profitable in practice.
The Inherent Limitations and Challenges
Despite their power, machine learning approaches face fundamental challenges in financial markets that limit their effectiveness.
Market Efficiency and the Prediction Paradox
Financial markets present a uniquely challenging prediction environment because they adapt to predictive signals:
- Signal Decay: As more market participants discover and act on a predictive signal, its value diminishes
- Adaptive Markets: The market itself evolves in response to the strategies being employed
- Self-Defeating Predictions: If enough capital acts on a prediction, the prediction itself may be invalidated
This creates an ongoing arms race where models must continuously evolve to maintain their edge.
Overfitting in Financial Machine Learning
The risk of overfitting is particularly acute in finance due to several factors:
- Low Signal-to-Noise Ratio: Financial data contains substantial randomness masking the underlying signals
- Limited Independent Samples: Many financial time series contain fewer truly independent observations than it first appears
- Multiple Testing Bias: With thousands of potential features and model configurations, finding spurious relationships is almost guaranteed without proper controls
Rigorous cross-validation, out-of-sample testing, and regularization techniques are essential but still may not fully prevent overfitting.
Regime Changes and Model Degradation
Financial markets undergo structural shifts that can render previously effective models obsolete:
- Macroeconomic Regime Changes: Shifts between inflationary/deflationary, high/low interest rate, or growth/value environments
- Market Structure Evolution: Changes in trading technology, regulation, or participant behavior
- Crisis Periods: Extreme market stress where historical relationships break down temporarily or permanently
- Competitive Adaptation: As strategies become popular, market participants adapt, neutralizing previously effective approaches
This non-stationarity means models require constant monitoring, validation, and periodic retraining or redesign.
The Black Box Problem and Regulatory Concerns
Complex machine learning models, particularly deep learning approaches, often function as "black boxes" where the reasoning behind predictions is opaque:
- Lack of Interpretability: Difficulty explaining why a particular prediction was made
- Regulatory Requirements: Increasing demands for model transparency in financial services
- Risk Management Challenges: Difficulty assessing model risk without understanding internal mechanisms
This has led to growing interest in explainable AI techniques that can provide insights into model decision processes.

From Prediction to Trading Strategy
Accurate predictions are only valuable if they can be translated into effective trading strategies.
Converting Predictions into Trading Signals
Raw model outputs must be transformed into actionable trading decisions:
- Thresholding: Determining when a prediction is strong enough to warrant taking a position
- Sizing: Scaling position size based on prediction confidence or volatility
- Timing: Determining optimal entry and exit points based on predictions
- Execution: Converting signals to orders while minimizing market impact
This signal processing layer is often as important as the prediction model itself in determining strategy performance.
Risk Management in ML-Driven Trading
Effective risk management is essential for long-term survival in markets:
- Position Sizing: Using risk-based position sizing to limit exposure to individual trades
- Stop-Loss Mechanisms: Automatically exiting positions when losses exceed thresholds
- Diversification: Spreading risk across multiple uncorrelated strategies
- Model Monitoring: Tracking model performance in real-time to detect degradation
Even the most accurate prediction model will eventually experience periods of underperformance, making risk management crucial for long-term success.
Portfolio Construction with Machine Learning
Machine learning can extend beyond individual asset prediction to optimize the entire portfolio:
- Multi-Asset Allocation: Dynamically adjusting exposure across different asset classes
- Risk Factor Management: Controlling exposure to various systematic risk factors
- Hierarchical Portfolio Construction: Building diversified portfolios of strategies rather than just assets
This portfolio-level approach often delivers more stable performance than strategies focused on individual asset prediction.
Conclusion
Machine learning offers powerful tools for asset price prediction, but success requires a nuanced understanding of both the capabilities and limitations of these methods. The most effective approaches combine sophisticated models with careful feature engineering, rigorous validation, and robust risk management.
Despite the challenges, machine learning continues to transform financial prediction, enabling strategies that can detect subtle patterns and adapt to changing market conditions. For those with the technical skills and market knowledge to implement them effectively, these approaches offer significant potential advantages.
However, it's important to maintain realistic expectations. The adaptive nature of financial markets means that no predictive edge lasts forever, and model development must be an ongoing process rather than a one-time effort. The most successful practitioners are those who continuously innovate, validate, and refine their approaches as markets evolve.
To see how quantitative techniques can be applied to optimize your investment portfolio, explore our portfolio optimization tools, which leverage advanced mathematical approaches to help you construct more effective investment strategies.
Free Trading Math & Risk Cheat Sheet
Every key formula in one PDF: breakeven win rates, expectancy, position sizing, drawdown recovery, volatility drag, VaR and CVaR. Plus occasional emails when we publish new quant tools.